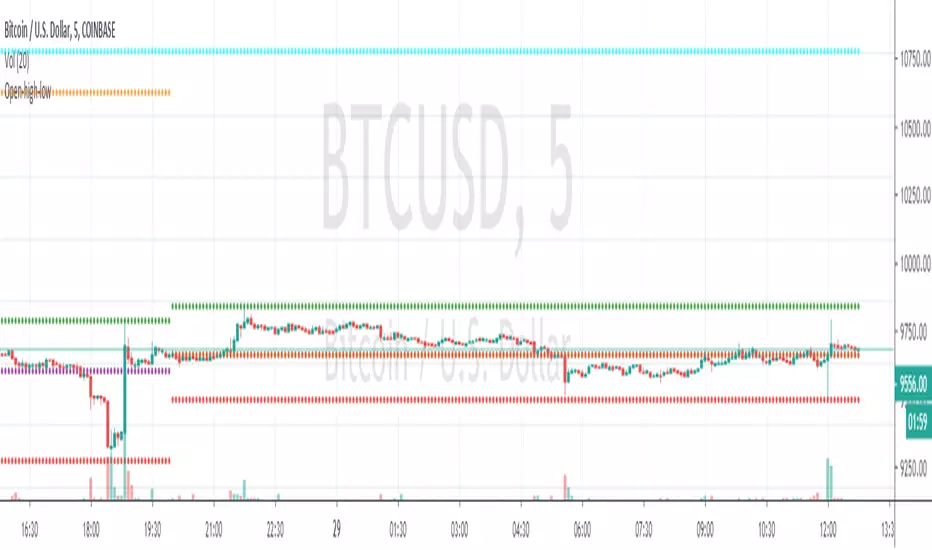
Day Open,High,Low Fib LevelsDay Open,High,Low Fibonacci Levels indicator depicts Fibonacci levels from Highest to lowest price levels vis-à-vis Day Open Price. The indicator is structured based on default Intraday number of bars. Hence the indicator and Gray Zone concept is effective in lower time frames .The indicator has also “Regular” Check in Box option under “Input” with default 14 bars under “Regular Length” to switch over from default Intraday Length.
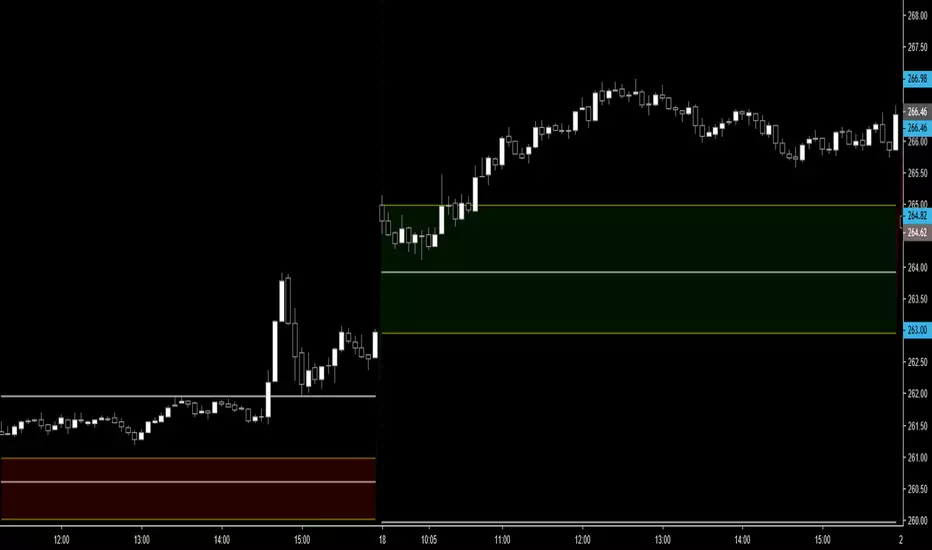
Green Zone represent area above Day Open Price when close is above Day Open Price.
Red Zone represent area below Day Open Price when close is below Day Open Price.
Gray Zone represent band within the Maximum and Minimum of Moving Averages of MA24,MA38,MA50,MA62,MA79 drawn with relevance to Fibonacci levels. The movement within this band is expected to be resistant prone on either direction.
Fibonacci levels between Highest and Lowest points during Green Zone and Red Zone are derived and reflected at 78.6,61.8,50.0,38.2 and 23.6 levels for users guidance.
Trades above Gray Zone are favored for Buy trades and below Gray Zone are favored for Sell trades. Trades within Gray Zone are resistant prone from either direction.
If number of bars in Gray Zone during Intraday are more than the combined number of bars above Green Zone and number of bras below Gray Zone then market may be assumed to be in Range bound state.
MA20 and MA200 are in default in display state. Position of MA 20 above and below Gray Zone and vis-à-vis MA Mid (Mid point in Gray Zone ) reflects the prevailing trend .MA 200 reflects the general Up trend or Down trend .
The Indicator reflects the Green Zone, Gray Zone ,Red Zone in the Table below the Chart depending on the position of Day Open Price below or above the Last Price .If the number of bars in the Gray Zone are more than the combined number of bars above and below Gray Zone the table reflect Range Bound Market.
Supplementing with other monitoring tools and Price Action dynamics the indicator assist the user to plan his entry and exit of trade based on the position of the market whether it is in Green Zone or Red Zone by taking into account the Fibonacci Levels.
DISCLAIMER : For educational and entertainment purpose only .Nothing in this content should be interpreted as financial advice or a recommendation to buy or sell any sort of security/ies or investment/s.
Pine Script® göstergesi